Execution Viewer
AxonFlow captures every step of both MAP plan executions and WCP workflow executions for debugging, auditing, and compliance. Whether your workflow is orchestrated by AxonFlow's Multi-Agent Planning engine or governed via the Workflow Control Plane (LangGraph, CrewAI, Temporal), every step gate check, policy decision, and completion event is recorded.
The Execution Viewer provides two interfaces: a CLI tool (axonctl) and an embedded web UI. Enterprise customers also get real-time SSE streaming for active executions.
Feature Overview
The Execution Viewer gives operators full visibility into every workflow execution:
| Feature | Description |
|---|---|
| Timeline | Step-by-step visualization of execution flow with timing data |
| Step Details | Expand any step to see LLM provider, model, prompt, and response |
| Policy Decisions | View which policies were evaluated and their allow/block decisions |
| Token Usage | Per-step and aggregate token counts (prompt + completion) |
| Cost Tracking | Estimated cost per step based on provider pricing |
| Export | Download execution data as JSON for compliance review |
| Replay | Re-walk through an execution step-by-step (CLI) |
CLI: axonctl executions
Setup
Build the CLI from the enterprise repository:
cd platform/cmd/axonctl
go build -o axonctl .
Configure authentication:
export AXONFLOW_ENDPOINT="http://localhost:8080"
export AXONFLOW_CLIENT_ID="your-org"
export AXONFLOW_CLIENT_SECRET="your-secret"
List Executions
axonctl executions list
axonctl executions list --status completed --limit 50
axonctl executions list --workflow-id my-workflow --format json
Output columns: ID, Workflow, Status, Steps, Duration, Cost.
Get Execution Details
axonctl executions get <execution-id>
Shows the execution summary, all steps with timing and LLM provider details, and triggered policy events.
Replay Execution
axonctl executions replay <execution-id>
axonctl executions replay <execution-id> --show-io
Interactive step-by-step replay in the terminal. Press Enter to advance through each step, q to quit. Steps are color-coded by status.
Export Execution
axonctl executions export <execution-id>
axonctl executions export <execution-id> --output report.json --include-io
Exports execution data as JSON for compliance review and audit trails.
Embedded Web UI
AxonFlow includes a lightweight execution viewer at /ui/executions/, accessible through the agent.
Access
http://localhost:8080/ui/executions/
The agent proxies UI requests to the orchestrator, which serves the static files. This follows the single-entry-point architecture where all user traffic goes through the agent.
List View
The main page shows all executions in a filterable, paginated table. Filter by status (completed, failed, running, pending) and workflow name.
Detail View
Click any execution to see:
- Summary card with execution ID, workflow, status, duration, token count, and cost
- Step timeline with expandable cards showing LLM details, policy events, and full input/output
- Export button to download the execution as JSON
Architecture
The UI uses vanilla JavaScript with Tailwind CSS (CDN). Static files are embedded in the Go binary via embed.FS, requiring no additional services or build steps.
API Reference
Both the CLI and UI use the same REST API:
| Endpoint | Description |
|---|---|
GET /api/v1/executions | List executions with filters and pagination |
GET /api/v1/executions/{id} | Get execution with all steps |
GET /api/v1/executions/{id}/steps | Get all steps |
GET /api/v1/executions/{id}/timeline | Get timeline view |
GET /api/v1/executions/{id}/export | Export for compliance |
See the SDK documentation for programmatic access to these endpoints.
Usage
Navigating the Web UI
- Open
http://localhost:8080/ui/executions/in your browser. - Use the Status dropdown to filter executions (completed, failed, running, pending).
- Click any row to open the Detail View.
- In the detail view, click a step card to expand it and see LLM details, policy events, and full input/output.
- Use the Export button to download the execution as a JSON file.
Navigating the CLI
# List recent executions
axonctl executions list --limit 20

# View a specific execution
axonctl executions get exec_abc123

# Replay interactively (press Enter to step through)
axonctl executions replay exec_abc123 --show-io
Enterprise: Execution Timeline
Enterprise customers get an Execution Timeline in the Customer Portal that goes beyond the embedded community viewer. It provides a production-grade monitoring experience designed for operations teams and compliance reviewers.
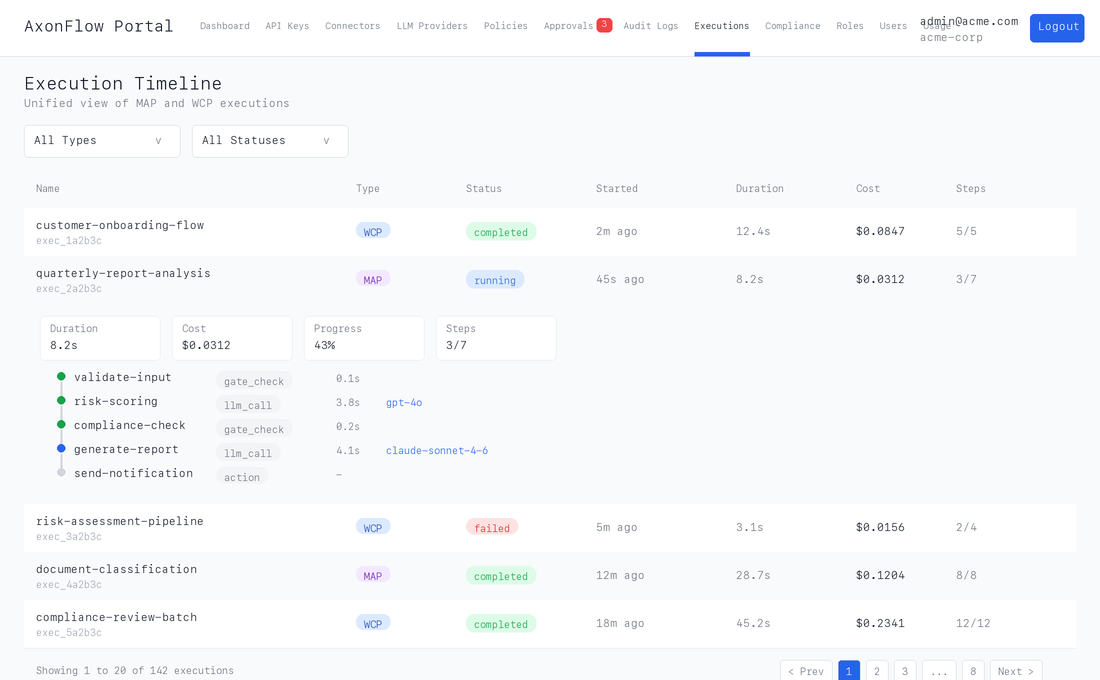
Key capabilities:
- Unified view of both MAP plans and WCP workflows in a single filterable table
- Inline step timeline with color-coded status dots, timing, and cost per step
- Policy gate visibility showing matched policies, block reasons, and approval status directly in the step timeline
- LLM usage details per step: model, provider, token counts, and cost in USD
- Full input/output JSON in collapsible sections for forensic analysis
- Pagination and filtering across thousands of executions by type and status
The community Execution Viewer is ideal for development and debugging. The Enterprise Execution Timeline is built for production operations at scale: multi-tenant, role-based access, and designed for teams who need to monitor AI workloads across the organization.
Learn more: Customer Portal
SSE Real-Time Streaming
Active executions can be streamed in real time via Server-Sent Events (SSE). This is useful for building dashboards or monitoring tools that show live execution progress.
# Stream execution status updates
curl -N http://localhost:8081/api/v1/unified/executions/{execution_id}/stream \
  -H "X-Client-ID: your-client" \
  -H "X-Client-Secret: your-secret" \
  -H "X-Tenant-ID: your-tenant" \
  -H "Accept: text/event-stream"
The stream emits events for step starts, completions, policy decisions, and workflow state transitions. The connection closes when the execution reaches a terminal state.
The execution_id is the workflow ID (for WCP workflows) or plan ID (for MAP executions). SSE streaming connects to the orchestrator (port 8081), not the agent. The SDK streamExecutionStatus() method handles this automatically.
Troubleshooting
Execution Viewer Returns Empty List
- Verify that workflows have been executed:
curl http://localhost:8080/api/v1/workflows/executions - Check the time range -- the UI defaults to the last 1 hour.
- Confirm the orchestrator is connected to the database:
docker compose logs orchestrator | grep database
Steps Show "No Data" for LLM Details
- Ensure the LLM provider is configured and returning usage metadata.
- Some providers (e.g., Ollama) may not report token counts. Check provider documentation.
Export Fails or Produces Empty File
- Verify the execution ID is valid:
axonctl executions get <id> - Check browser console for network errors if using the web UI.
- Ensure the orchestrator has read access to the executions table.
CLI Cannot Connect
- Verify environment variables are set:
echo $AXONFLOW_ENDPOINT    # Should be http://localhost:8080
echo $AXONFLOW_CLIENT_ID
echo $AXONFLOW_CLIENT_SECRET - Check that the Agent service is running:
docker compose ps agent
